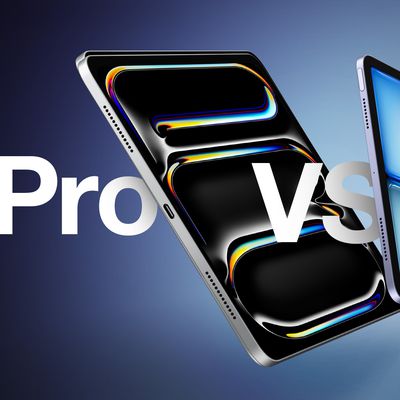
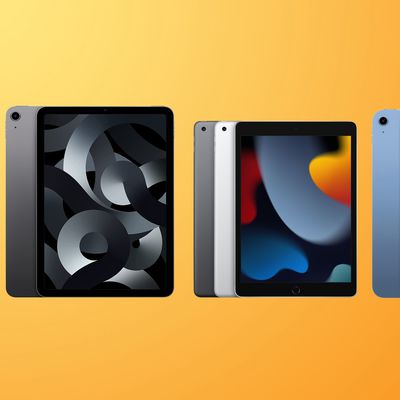
iPad Air vs. iPad Pro Buyer's Guide: 30+ Differences Compared
The iPad Air is now available in two size options, just like the iPad Pro. Yet after a significant update to the iPad Pro that introduces a thinner design and OLED displays, how different are the two product lines and which should you buy? The introduction of the fourth-generation iPad Air in September 2020 brought the device much closer to the iPad Pro in terms of design, and with the most...
Read Full Article • 115 comments
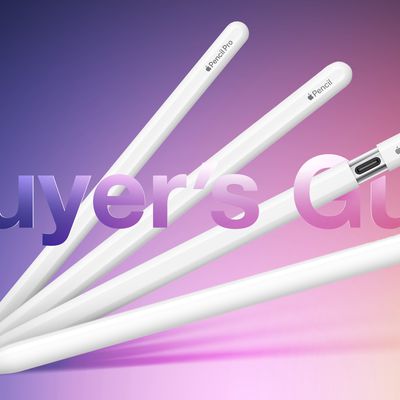
Apple Pencil Buyer's Guide: Which Model Should You Choose?
Apple now offers four different Apple Pencil models at $79, $99, and $129 price points, each with different feature sets and compatibility. Our guide helps you decide which Apple Pencil is best for you. Which Apple Pencil you should buy is firstly determined by which iPad model you have. Some iPad models are only compatible with one kind of Apple Pencil, while others are compatible with two. ...
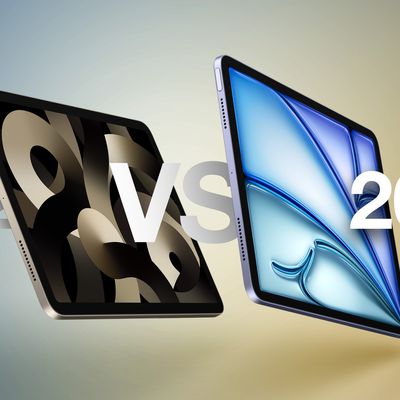
iPad Air 2022 vs. iPad Air 2024 Buyer's Guide: 19 Differences Compared
Apple's new iPad Airs arrive almost a year and a half after the previous models, offering almost 20 changes and upgrades. The 2022 iPad Air was a minor upgrade that added features such as the M1 chip and a 12MP Ultra Wide front-facing camera with Center Stage. The 2024 refresh is more substantial, headlining with a larger size option for the first time, bringing it in line with devices like ...
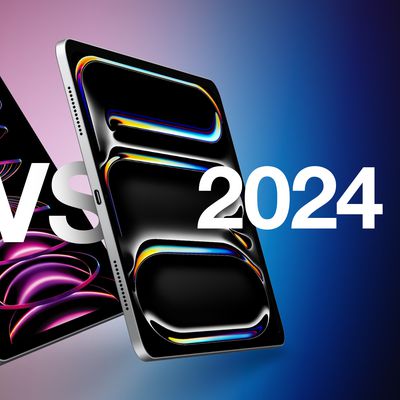
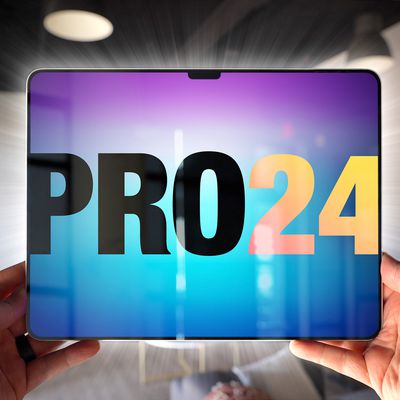
iPad Pro 2022 vs. iPad Pro 2024 Buyer's Guide: 25 Differences Compared
Apple's new iPad Pro models come almost a year and a half after their predecessors, offering 25 significant changes and upgrades. The 2022 iPad Pro was a minor upgrade that added the M2 chip and Apple Pencil hover, as well as support for Wi-Fi 6E, Bluetooth 5.3, and Smart HDR 4. The 2024 refresh is much more substantial, with more than two dozen changes and generation-over-generation...
What to Expect From the May 7 Apple Event
Apple is set to hold its first event of the year next Tuesday, and the focus will be on the iPad. The iPad Pro and iPad Air models are set to be updated, and Apple also plans to refresh some of its iPad accessories. The video-based event will last for about 35 minutes. Subscribe to the MacRumors YouTube channel for more videos. This guide features details on everything that we're expecting to ...
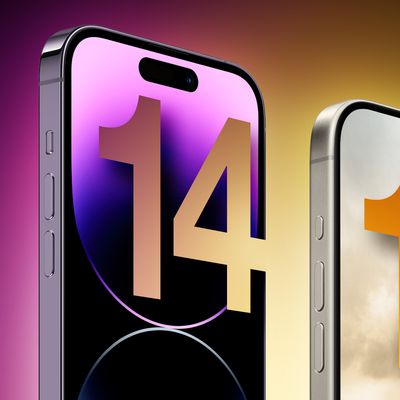
iPhone 14 Pro vs. iPhone 16 Pro: 50+ Upgrades to Expect
The iPhone 16 Pro is set to succeed 2023's iPhone 15 Pro, introducing over 25 new features and improvements to Apple's high-end smartphones. With many users adopting two-year upgrade cycles, plenty of iPhone 14 Pro owners will be looking to upgrade to the iPhone 16 Pro later this year, so this guide breaks down every major difference you should be aware of between the two generations based on...
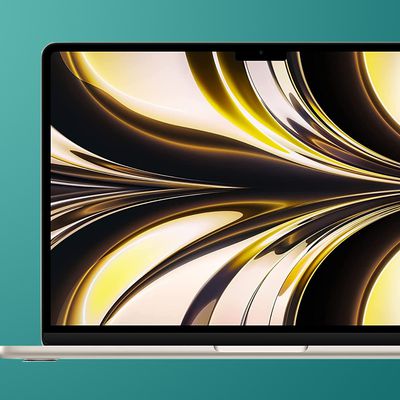
Apple's 2025 M4 MacBook Air: What to Expect
Apple is working to introduce a new fourth-generation Apple silicon chip across the Mac lineup, and while the first M4 Macs are coming in 2024, the MacBook Air won't get updated until 2025. This guide highlights everything that we know about the next-generation MacBook Air so far. M4 Chips The 13-inch and 15-inch MacBook Air models were just updated with M3 chips in March 2024, so it's...

AirPods 4 Rumors: Everything We Know So Far
Apple introduced the third-generation AirPods nearly three years ago and an all new model is now slated to launch later this year with a range of improvements and new features. Many of the changes and improvements introduced with the third-generation AirPods originated on the first-generation AirPods Pro. As such, it seems likely that many of the upgrades coming to the fourth-generation...
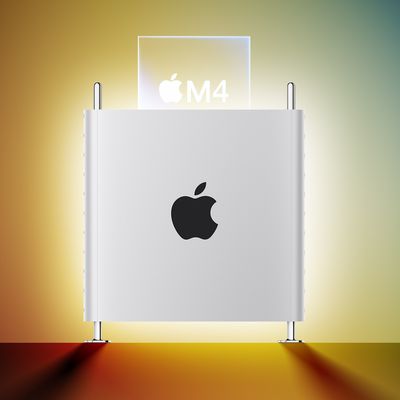
Apple's 2025 M4 Mac Pro: What to Expect
Apple last updated the Mac Pro in June 2023, adding an M2 Ultra chip and officially completing the transition away from Intel chips. The Mac Pro uses the same M2 Ultra chip that's in the Mac Studio, leading to criticism about its lack of power. Apple has now gone back to the drawing board and is working on an updated version of the Mac Pro that's set to come out next year. This guide...
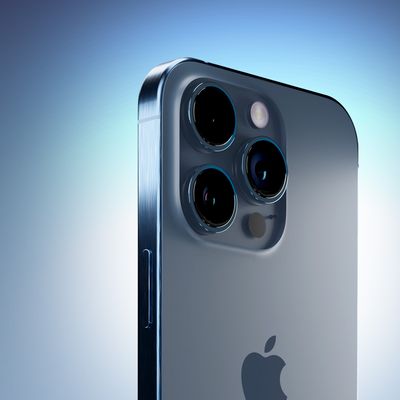
6 iPhone Camera Tips Every User Should Know
Apple's latest iPhones include several headline camera features that are worth using, such as Portrait Mode and Photographic Styles. But if all you want to use is the standard photo mode, there are still several tools and settings that can improve the composition of your pictures and help you capture the perfect shot using more traditional techniques. Whether you are the owner of a new...
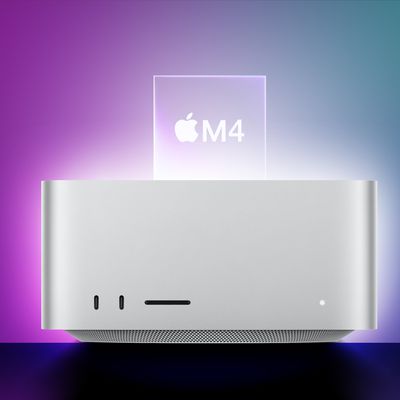
Apple's M4 Mac Studio: What We Know So Far
Apple is planning to refresh the entire Mac lineup with updated M4 chips starting in late 2024 and continuing into 2025, and that will include a new M4 chip for Apple's mid-tier desktop machine, the Mac Studio. M4 Chip Rumors Apple has a lineup of M4 chips in development, including the standard M4, the M4 Pro and M4 Max, and a higher-end version that's codenamed "Hidra." This higher-end...
When Are New iPads Coming Out?
Update: Apple has announced it will be holding a special event on Tuesday, May 7 at 7 a.m. Pacific Time. The invite graphic for the streamed event, titled "Let Loose," depicts an Apple Pencil drawing a flurry of colors – a heavy hint that new iPads will feature. The last iPad Apple released was the 10th generation iPad in October 2022, over 540 days ago. With no iPad launches in 2023,...
8 Things You Never Knew Your Mac Can Do
Apple doesn't exactly telegraph older Mac software features, but there are several useful time-saving tricks hidden in your Mac's operating system that you may not be aware of. Here are eight quick tips that could be key to turbo-charging your productivity. This article assumes you're using a Mac running macOS Sonoma, but most of these tips also work in earlier versions of Apple's Mac...
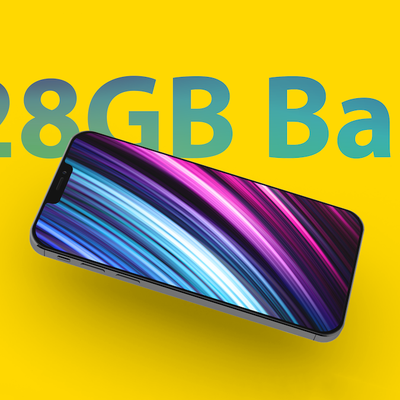
Is 128GB Enough iPhone Storage?
The iPhone 15 offers "lots of storage for lots of photos," or at least that's what Apple boasts in its latest ad. Whether that rings true for you depends on what you do with your iPhone, and which storage option you choose. But before you open your wallet, here are some things to consider. The entry-level storage tier for the iPhone 15 is 128GB. That's a notable increase from the 64GB...
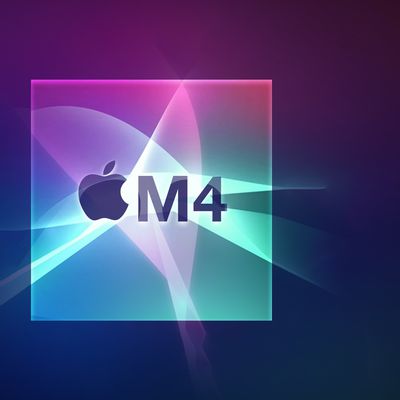
Apple's M4 MacBook Pro Lineup: What to Expect
Apple is planning to refresh the MacBook Pro with M4 chips starting in late 2024, and this guide aggregates everything that we know about Apple's M4 MacBook Pro plans. M4 Update Apple built the M3 chip on a new 3-nanometer process, and we are not expecting a node change for the M4. It too will be a 3-nanometer chip, but Apple supplier TSMC could introduce updates that make it more efficient ...
iPhone 15 vs. iPhone 16: 15+ Rumored Upgrades Compared
After over a year of reports, there are now more than a dozen specific rumors about the features and improvements set to be offered by the two non-Pro iPhone 16 models later in 2024. All of the changes the iPhone 16 models are expected to feature compared to their direct forerunners are listed below, using information from a range of reliable sources that we have previously covered. We will ...
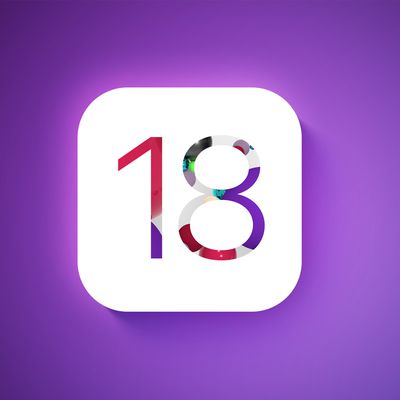
Will My iPhone Run iOS 18?
Apple in September will release iOS 18, its next-generation software update for compatible iPhones. Keep reading to learn if Apple's upcoming mobile operating system will run on your particular iPhone model. What to Expect in iOS 18 iOS 18 promises a slew of enhancements and new features that could redefine how we use our iPhones, according to rumors. Some Apple software engineers even...
Everything New in the iOS 17.5 Beta
Apple is currently testing iOS 17.5, the fifth major update to the iOS 17 operating system that came out last September. Like iOS 17.4, iOS 17.5 primarily focuses on regulatory changes in the European Union, but there are a few other features worth noting. This guide aggregates everything that's been found during the iOS 17.5 beta testing period so far. App Downloads From Websites (EU...

iPhone 15 Pro vs. iPhone 16 Pro: 30 Rumored Upgrades Compared
After over a year of rumors, there are now 30 changes and improvements expected to be offered by the iPhone 16 Pro models later this year. Subscribe to the MacRumors YouTube channel for more videos. All of the changes the iPhone 16 Pro models are expected to feature compared to their direct forerunners are listed below, using information from reliable sources that we have previously covered. ...

When Will iOS 18 Be Released?
Set to be announced at this year's Worldwide Developers Conference, iOS 18 and iPadOS 18 are Apple's next-generation operating systems for iPhone and iPad. Apple's 35th annual Worldwide Developers Conference will take place from June 10 to June 14, with a keynote event set to be held on Monday, June 10 at 10:00 a.m. Pacific Time to introduce the new software. Shortly after the...